Why stay invested (even in a down market)?
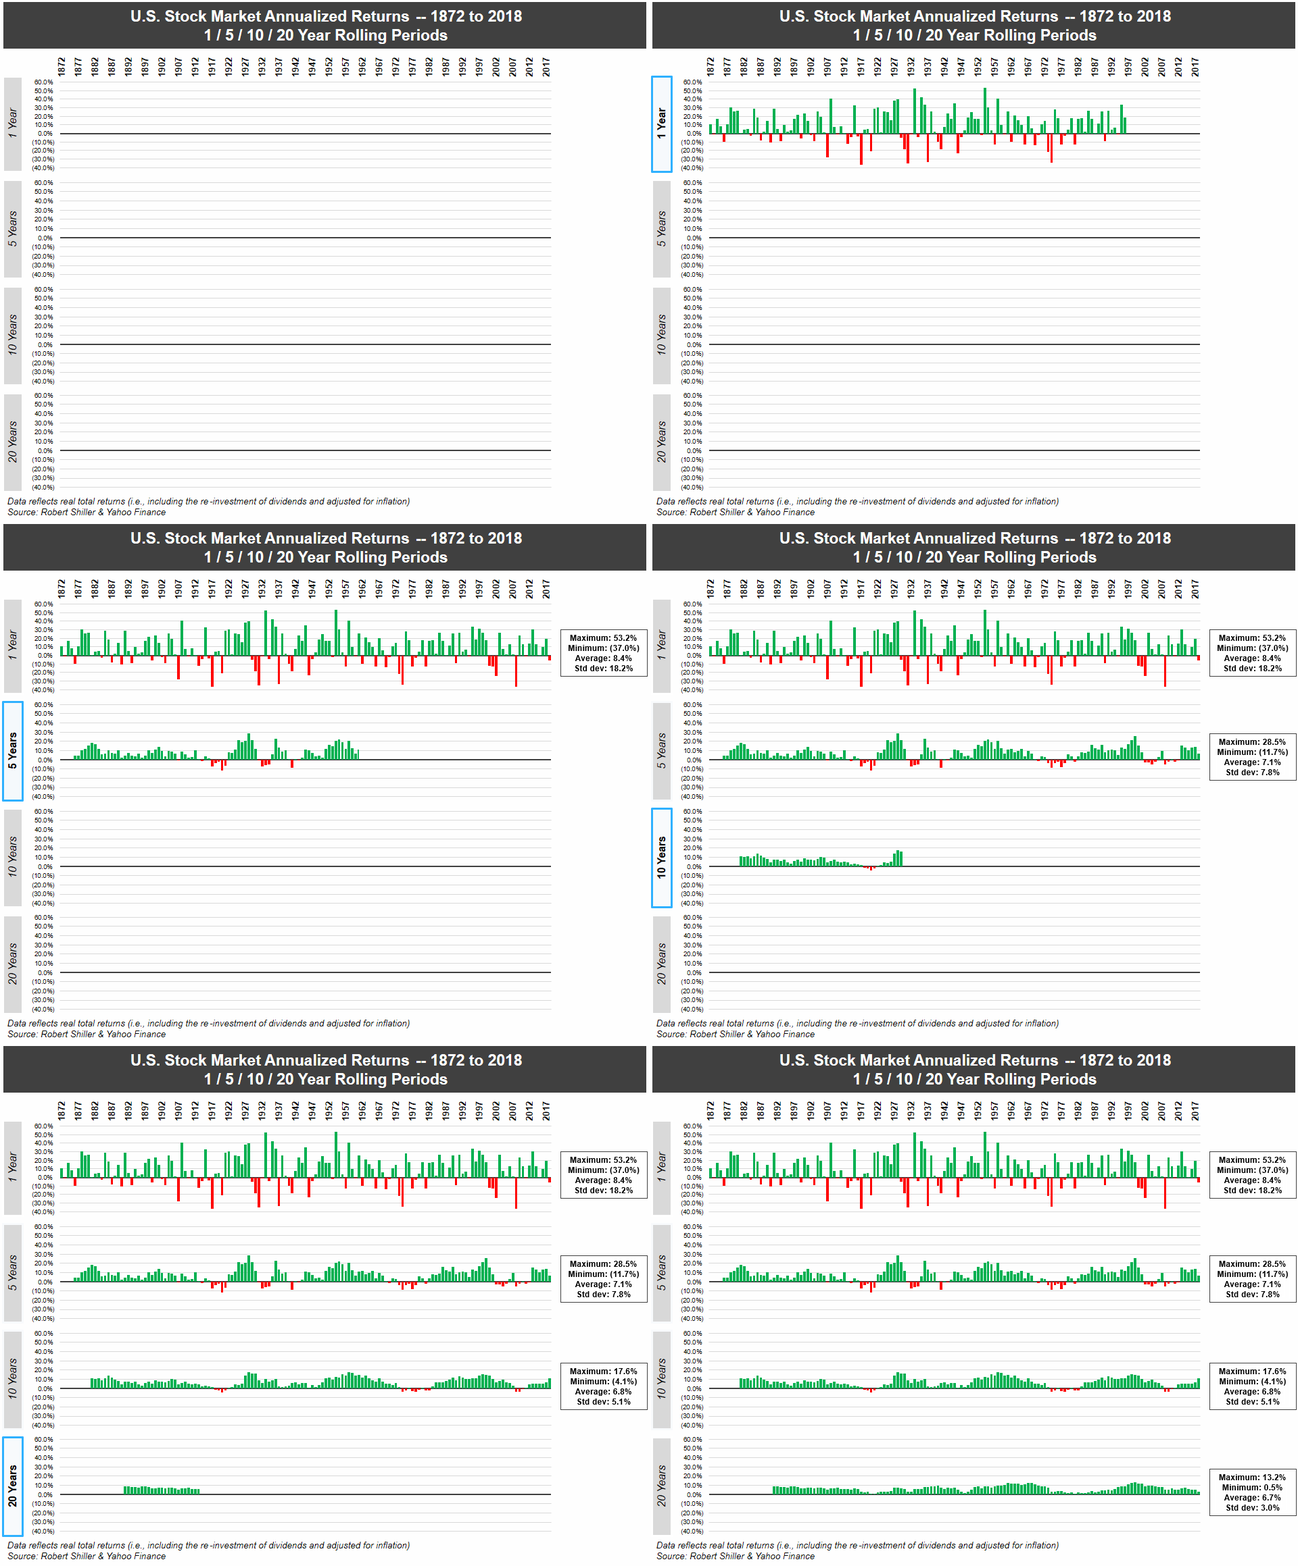
The following graph shows the rolling returns (returns over X consecutive years) for 1, 5, 10 and 20 years. The green lines are positive returns and the red are negative returns. Each consecutive line shows more green lines and fewer red lines thus showing that the longer you stayed invested, the better chance of positive returns.
The longer you were invested, the lower the volatility (standard deviation).


